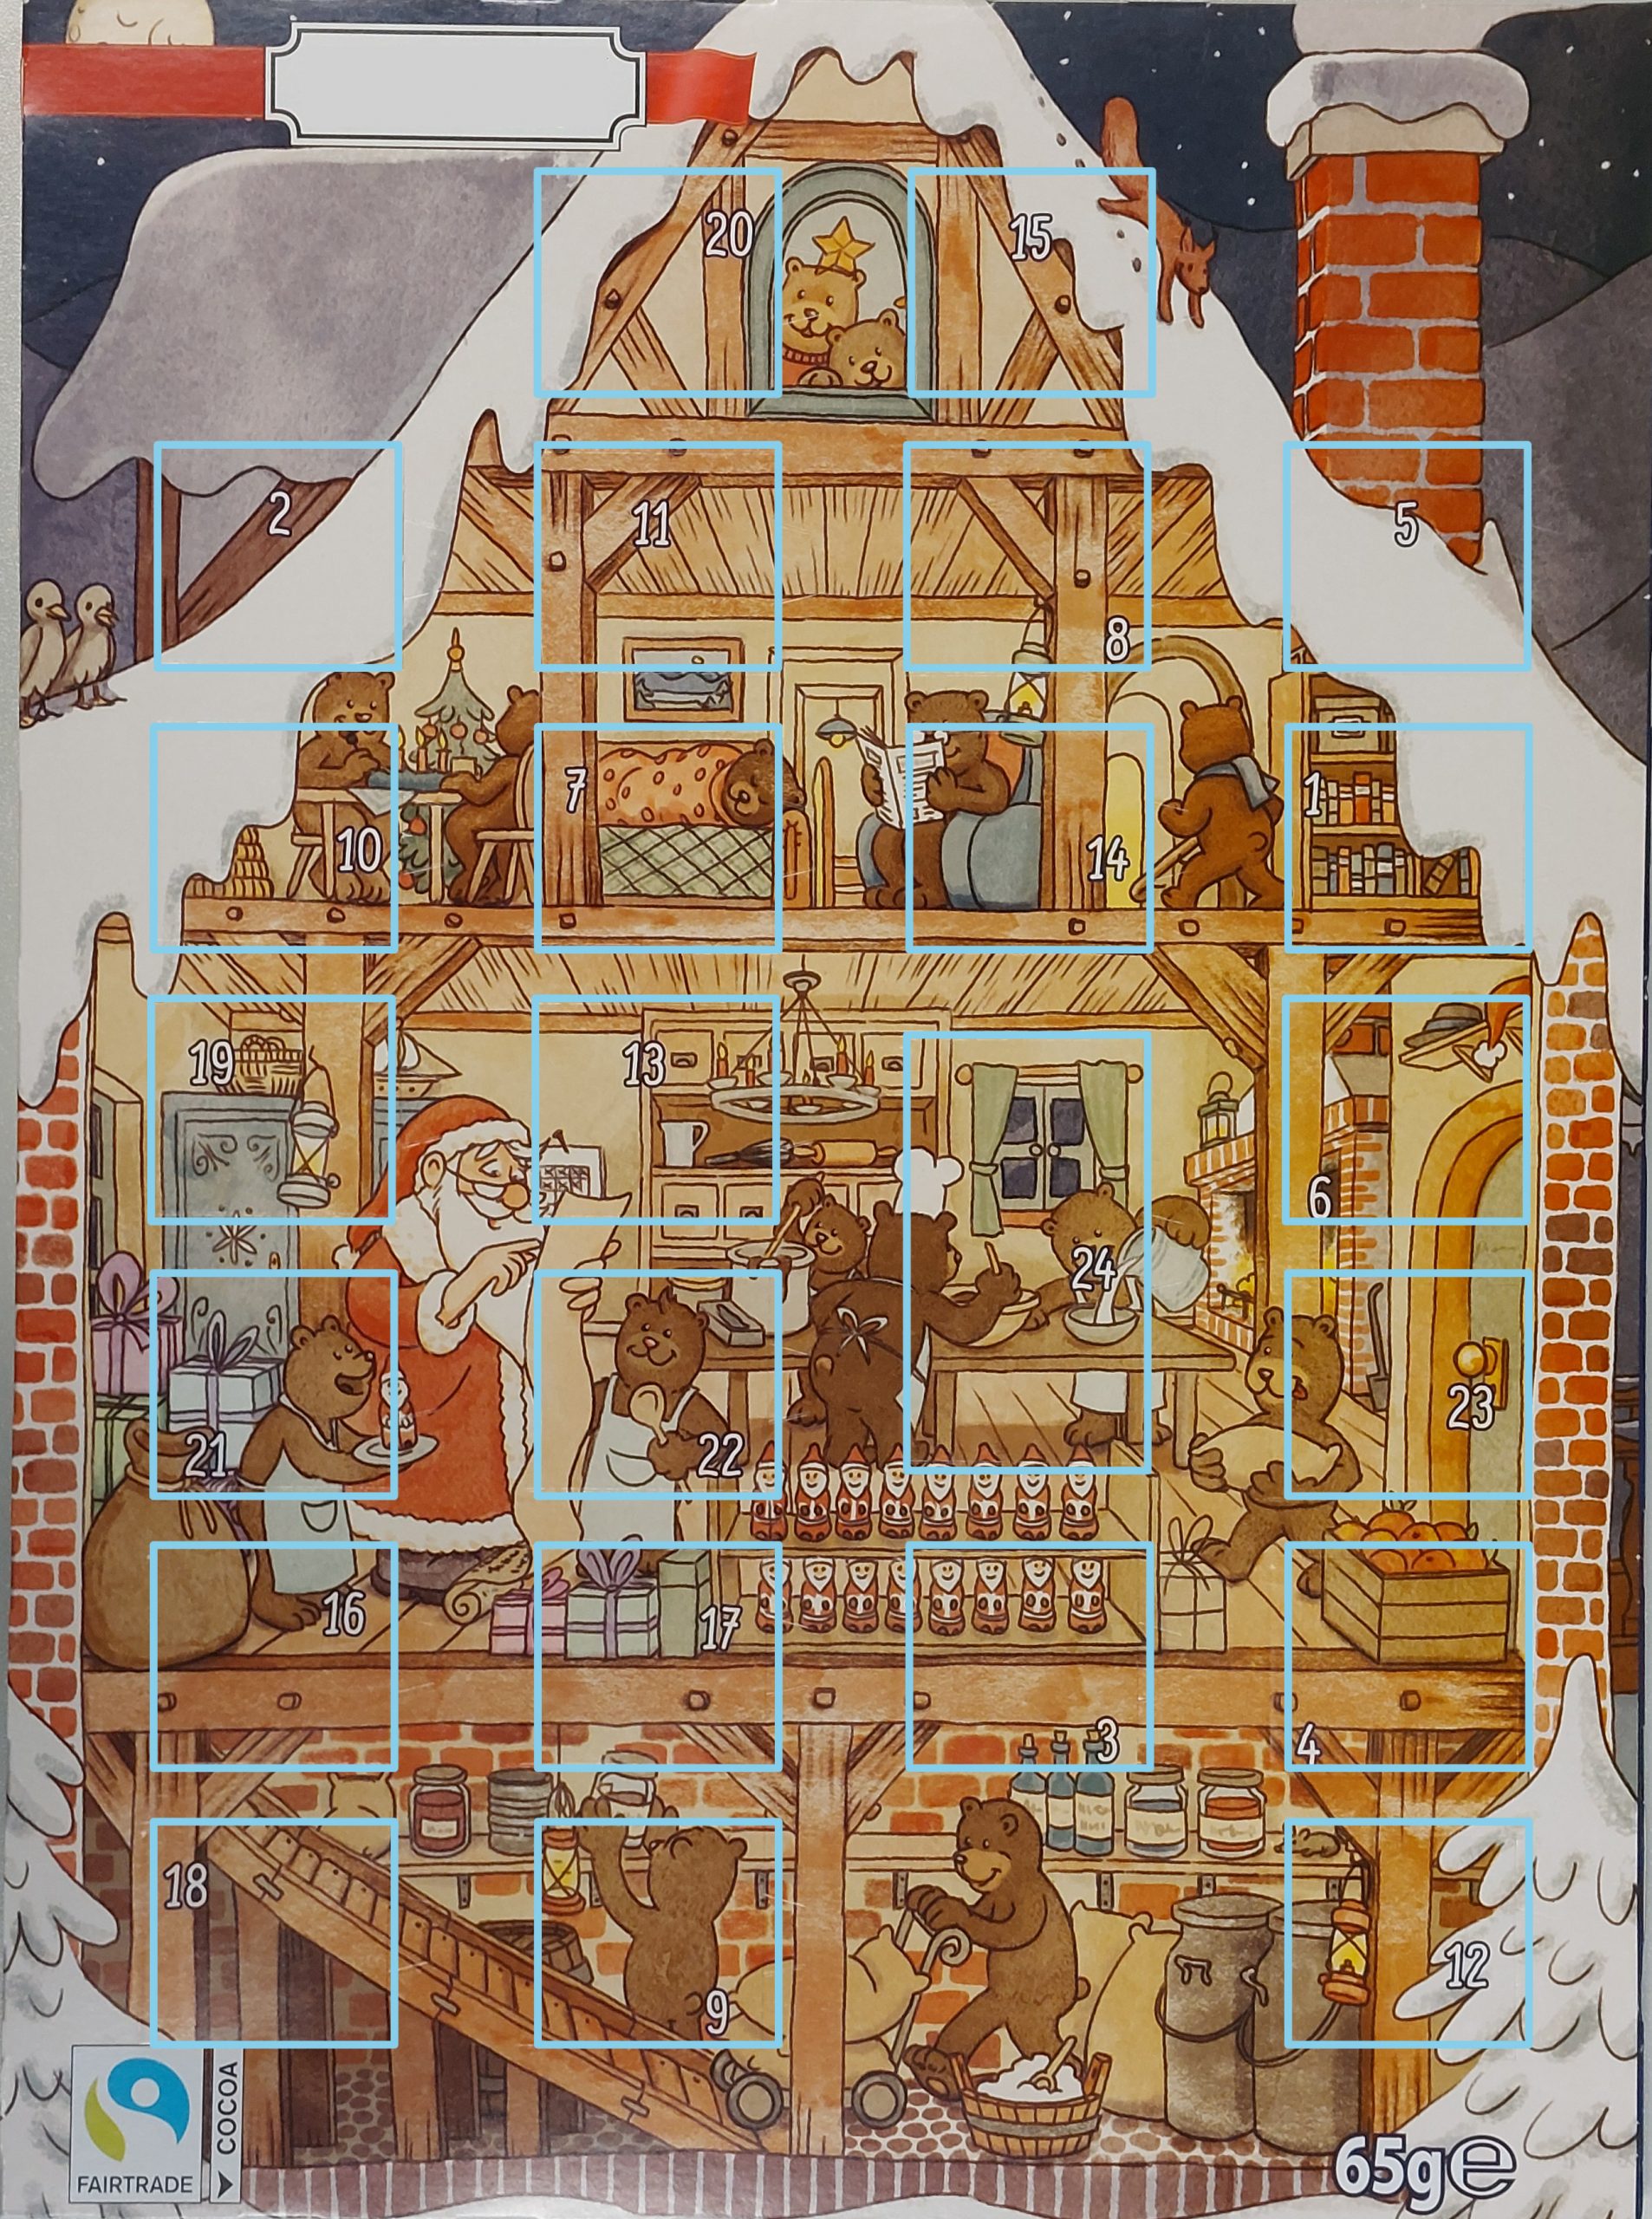
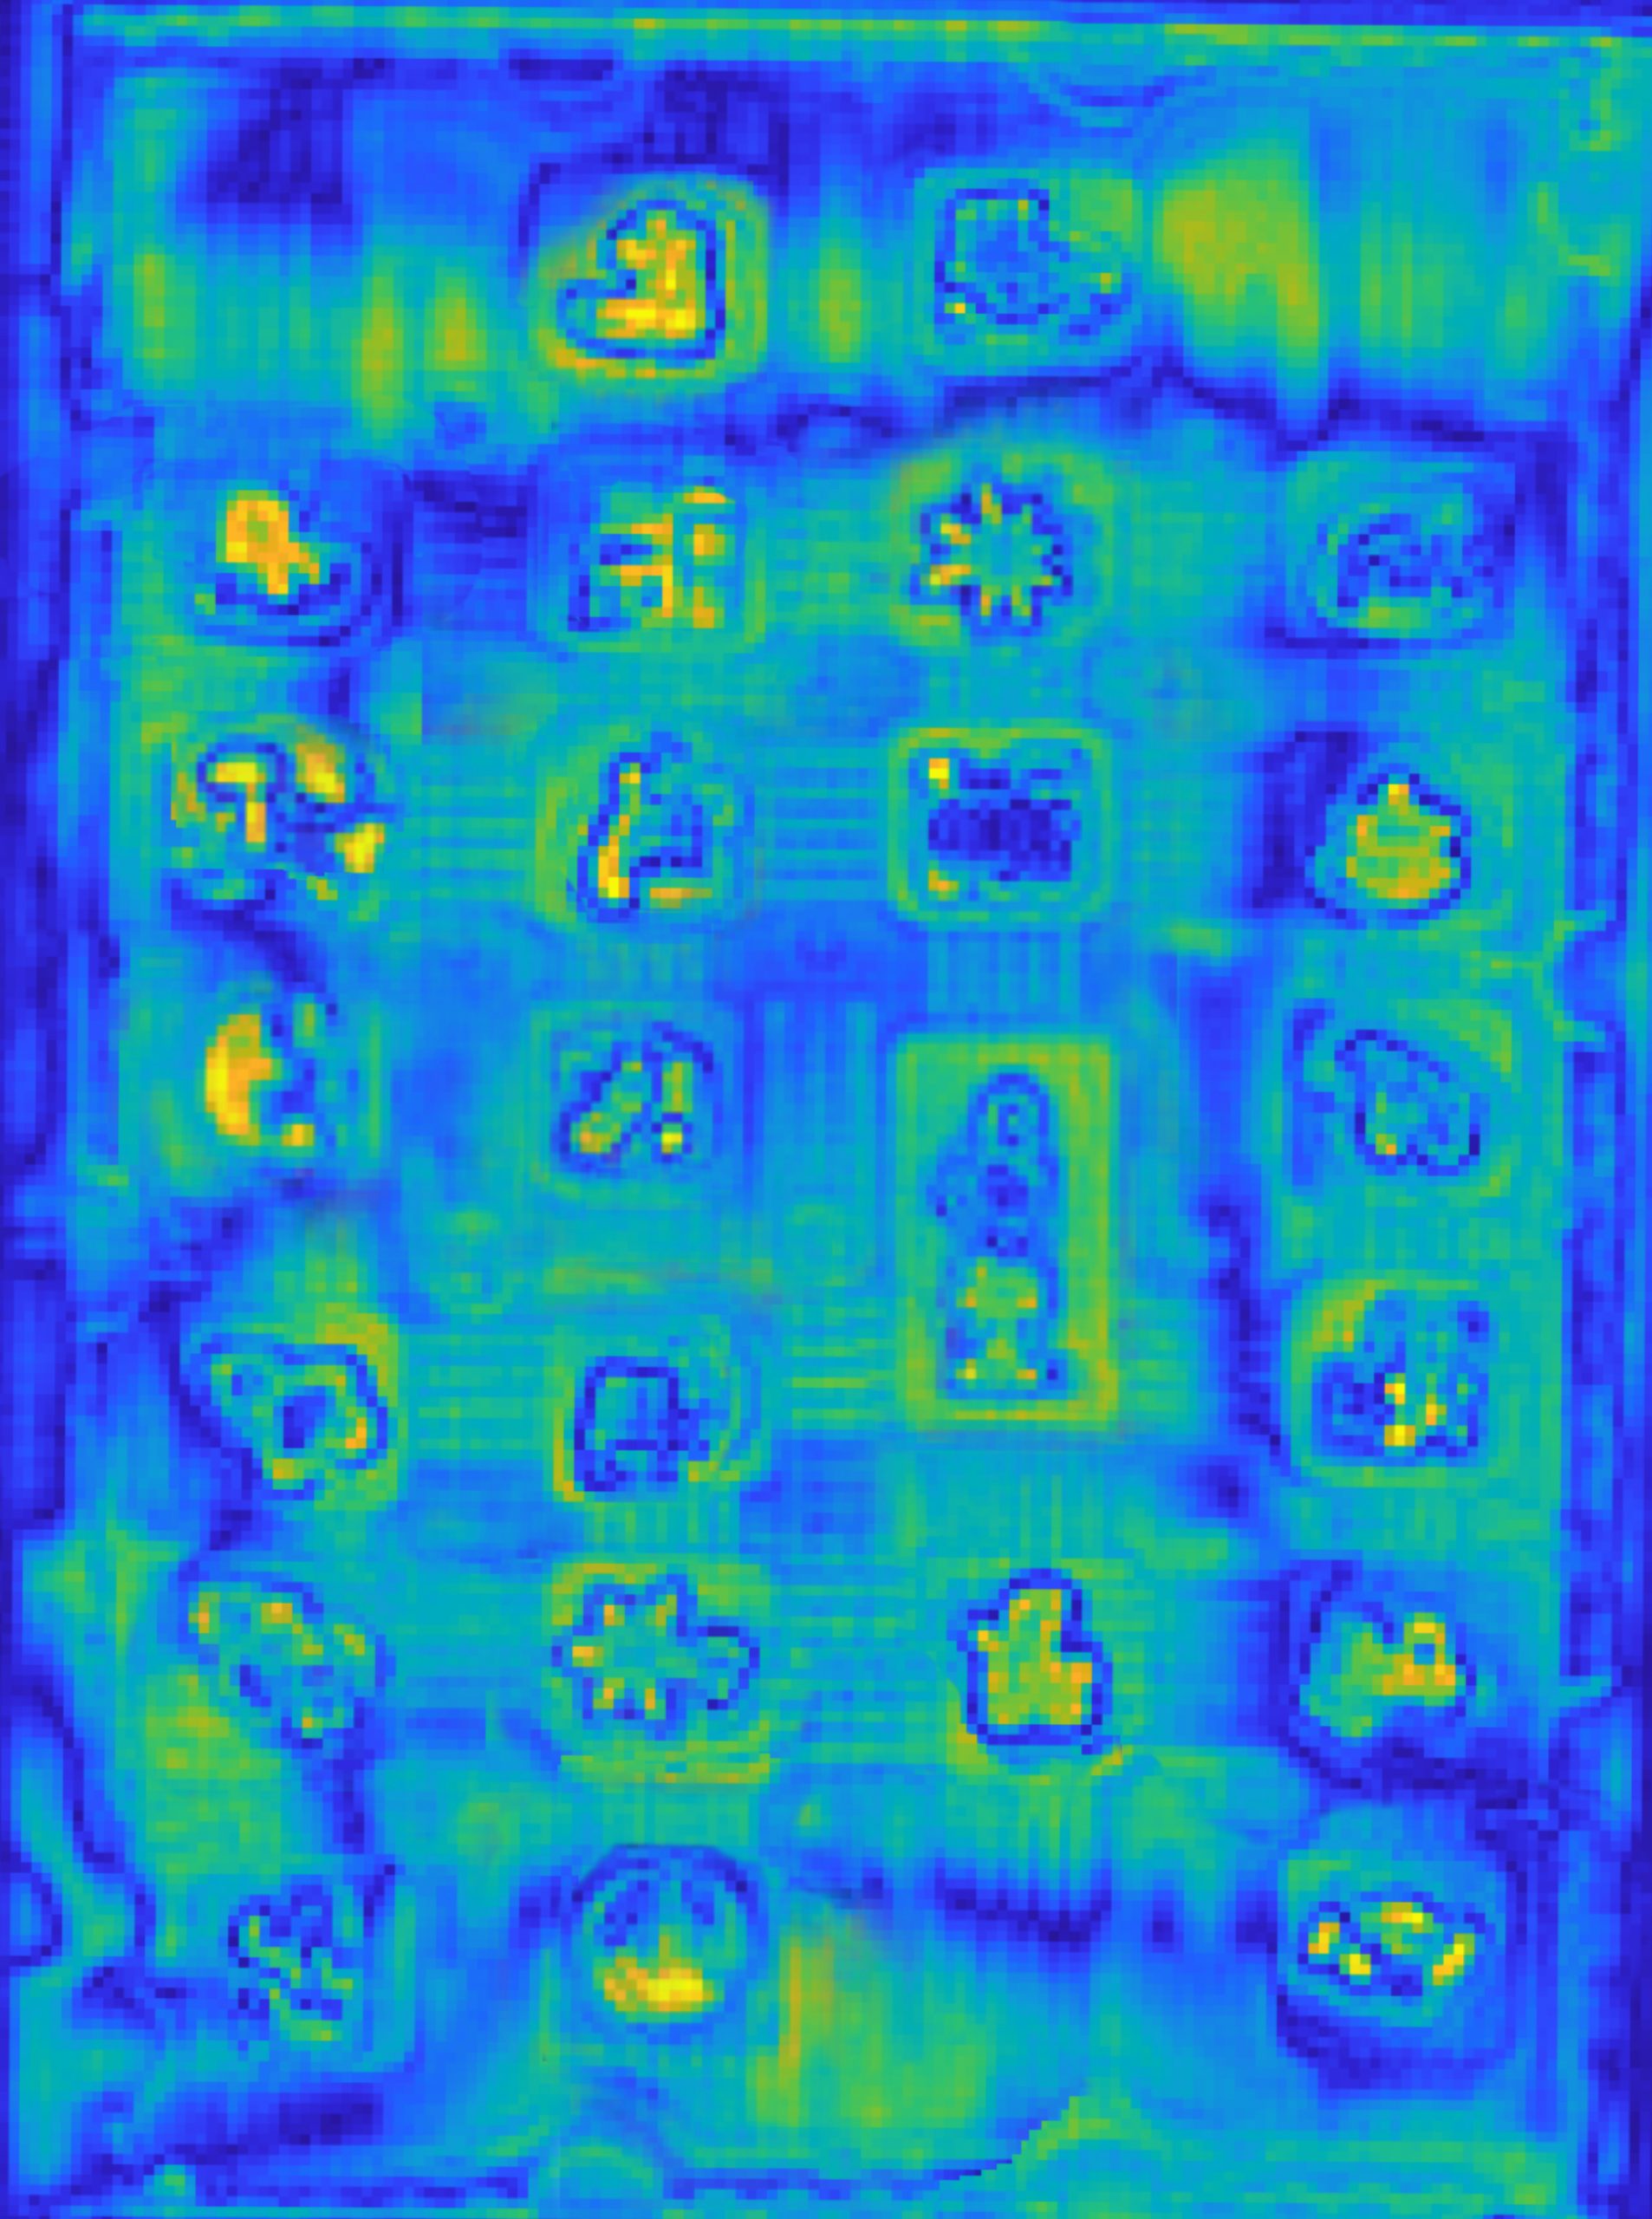
Weihnachtskarte 2025
Unsere diesjährige Weihnachtskarte zeigt ein außergewöhnliches Motiv: den Reflexions-Scan eines Schokoladen-Adventskalenders im Millimeterwellenbereich bei 76,5 GHz. Für diese Messung kam die Reflexionsoption unseres bewährten Radom-Messsystems RMS-DXY-77|79G zum Einsatz.
Der Adventskalender wurde auf einem Präzisions-Lineartisch zeilenweise abgetastet. Insgesamt werden mehrere zehntausende Einzelmessungen erfasst. Aus diesen Daten berechneten wir mithilfe der Synthetic Aperture Radar (SAR) Technologie ein hochauflösendes dreidimensionales Radarbild. Ursprünglich für die Fernerkundung entwickelt, wird SAR heute auch in automobilen Radarsystemen genutzt, um wetterunabhängige hochauflösende Radarumgebungskarten für automatisierte Fahrfunktionen bereitzustellen.
Wir setzen diese Technologie ein, um das Reflexionsverhalten von Materialien und Radarabdeckungen präzise zu analysieren und geben damit Einblick in einen Schokoladen-Adventskalender ohne die Türchen öffnen zu müssen. Selbst kleinste Strukturen von rund 2 mm lassen sich damit sichtbar machen.
Heute ist diese Option vollständig in unser Produkt RMS-DXY integriert und steht auch unseren Kunden zur Verfügung. Bei Fragen sprechen Sie uns gerne an!
Spezifikation der Weihnachtskarte
- Messsystem: Radom-Messsystem (RMS-DXY-SAR-77|79G)
- Messgröße: Reflektion in Amplitude
- Messreferenz: goldene 100% metallische Platte
- Messbereich: 295 mm x 200 mm
- Auflösung: 1.6 mm/Pixel
- Erfasster Frequenzbereich: 75 bis 78 GHz (Millimeterwellenbereich)
Weihnachtskarte 2024
Die diesjährige Weihnachtskarte und das Video unten zeigen den Radarrückstreuquerschnitt (RCS) eines Keramiksterns gemessen in einer Compact Range bei perisens.
Der Radarrückstreuquerschnitt (RCS) ist ein Maß für die Zielgröße eines Objekts in der Radartechnik und wird in m² angegeben. Der RCS wird in erster Linie durch die Körperform bestimmt und gibt nur bedingt Auskunft über die geometrische Größe. Beispielsweise hat eine Metallkugel mit einem Radius von 10 cm ein RCS von 0,03 m². Bei komplexeren Körpern kann der RCS abhängig vom Betrachtungswinkel stark variieren. Ein Motorrad hat beispielsweise ein mittleres RCS von 1m².
Für eine RCS-Messung muss sich das Objekt im Fernfeld befinden, was bei Frequenzen für automobile Radarsensoren selbst für kleine Objekte sehr große Abstände erfordert. Beispielsweise müsste die Messung des 12cm großen Keramiksterns bereits in einer Entfernung von mindestens 7,4m erfolgen. Um die Messentfernung zu verkürzen, wurde ein Compact Range verwendet, der das Ziel über einen Präzisionshohlspiegel in einen unendlichen Abstand transformiert. Dieser Hohlspiegel, der im eigenen Haus entwickelt und konstruiert wurde, misst 630 x 630 mm² und wurde aus einem massiven Aluminiumblock mit einer Oberflächentoleranz von nur 10 µm gefräst.
Die Messung zeigt das RCS eines Keramiksterns bei 76.5 GHz über den Winkel gemessen. Deutlich sind die Peaks in Richtung der Spitzen bei 0°, 72° und 142° zu erkennen. Die Reflexion wird jedoch nicht von der Spitze selbst verursacht, sondern von den beiden ebenen Flächen der benachbarten Spitzen, die senkrecht zu der einfallenden Welle ausgerichtet sind und daher eine starke Rückreflexion verursachen. In den Maxima beträgt das RCS ca. 3m² und wäre für ein automobiles Radar im Abstand von 100m noch gut sichtbar. Außerhalb dieser Spitzen sinkt der Wert auf unter 0,01m² und wäre kaum noch bei wenigen Metern erkennbar.
Heute werden Compact Ranges zur Kalibrierung von automobilen Radarsensoren während der Produktion eingesetzt, um die dazu notwendigen Radarzellen kompakt realisieren zu können und damit die erforderliche Stellfläche in der Produktion zu minimieren.
Bitte zögern Sie nicht, uns zu kontaktieren, wenn Sie Fragen haben oder Interesse an unserer Compact Range.
Spezifikation der Weihnachtskarte
- Messsystem: VNA mit Compact Range, perisens
- Spiegelgröße: 630 mm x 630 mm
- Durchmesser der Quiete Zone (QZ): 200 mm
- Amplitudehomogenität (QZ): besser als 1dB
- Phasenhomogenität (QZ): besser als +/-2°
- Frequenzbereich: 60 bis 90GHz


Weihnachtskarte 2023
Die diesjährige Weihnachtskarte zeigt ein hochauflösendes Reflexionsbild einer metallischen Schneeflocke, gemessen bei 76,5 GHz. Das Bild wurde mit der neuen Reflexionsoption unseres erfolgreichen Radom-Messsystems RMS-D-77|79G erzeugt.
Die metallische Schneeflocke wird mit einem Präzisions-Lineartisch zeilenweise abgetastet und alle 1,6 mm wird eine Reflexionsmessung ausgelöst. Aus den mehr als 24 Tausend Einzelmessungen wird dann mit Methoden des Synthetic Aperture Radar (SAR) ein hochauflösendes zweidimensionales Radarbild berechnet. SAR kommt ursprünglich aus der Fernerkundung, um hochauflösende Radar-Geländekarten von Satelliten oder Flugzeugen aus zu messen. Heute werden SAR-Methoden auch in automobile Radarsensoren eingesetzt, um hochauflösende Radarkarten der Umgebung nahezu wetterunabhängig zu erstellen. Die Informationen können z. B. für automatisierte Einparkvorgänge genutzt werden. In unserem Messsystem nutzen wir die Technologie, um das Reflexionsvermögen von Radardeckeln in hoher Auflösung zu analysieren. Dabei können wir selbst kleinste Defekte (Inhomogenitäten) von etwa 2 mm Größe erkennen und sichtbar machen.
Unsere erste Weihnachtskarte aus dem Jahr 2016 wurde ebenfalls mit einem SAR-Setup gemessen. Mit der Integration in unser Produkt RMS-D stellen wir diese Messung nun auch unseren Kunden zur Verfügung. Bitte zögern Sie nicht uns zu kontaktieren, wenn Sie Fragen haben.
Spezifikation der Weihnachtskarte
- Messsystem: Radom-Messsystem (RMS-D-77|79G) mit SAR-Option
- Messblende: 255 mm x 245 mm
- Auflösung: 126 x 126 Pixel
- Messzeit: 5 min
- Erfasster Frequenzbereich: 75 bis 78 GHz (Millimeterwellenbereich)
Weihnachtskarte 2022
Für die Gestaltung der diesjährigen Weihnachtskarte konnten wir MERCK als Spezialisten für Farbpigmente gewinnen. Farbpigmente in Autolacken haben einen wesentlichen Einfluss auf deren Radarverhalten.
Durch neu eingeführte automatisierte Fahrfunktionen, wie z.B. das automatisierte Überholen, steigen die Anforderungen an Radarsensoren stetig. Da diese Sensoren typischerweise an Fahrzeugecken hinter in Fahrzeugfarbe lackierten Stoßfängern angebracht sind, muss der Radareinfluss von Lacken berücksichtigt werden. Insbesondere leitfähige Aluminiumpigmente können sich negativ auf die Radartransparenz auswirken.
Unsere Messtechnik bietet unseren Kunden die Möglichkeit, ihre Pigmente und Lacke zu optimieren, um eine optimale Radartransparenz zu gewährleisten. Neben der Forschung und Entwicklung werden unsere Radarmesssysteme auch in der Produktion eingesetzt, um komplette Stoßfänger zu testen und so sicherzustellen, dass die Radarsensoren eine saubere Sicht durch den Stoßfänger haben.
Die Idee zu dieser Weihnachtskarte ist aus unserer Zusammenarbeit mit MERCK entstanden. Die Zutaten: eine gute Idee, ein bisschen „Maskierungsarbeit“, einige der Meoxal®-Pigmente von MERCK (auf Aluminiumsubstratbasis), ein paar Farbstoffe und etwas Bindemittel, 6 Applikations- und Maskierungsschritte – und all das ergab eine wunderschöne bemalte Kerze. Die Kerze wurde dann in unserem Labor mit einem robotergestützten Radom-Messsystem (RMS) vermessen und hier ist das Ergebnis…
Das Radarbild zeigt die Einweg-Transmission durch die lackierte Folie. Man erkennt deutlich den Einfluss der Farbe, der mit höherem Metallgehalt zunimmt. Das erste Bild zeigt den Phasenwert, der die elektrische Dicke darstellt, während das zweite Bild die Übertragung der elektromagnetischen Welle und damit die Dämpfung zeigt.
Spezifikation der Weihnachtskarte
- Messsystem: Radom-Messsystem (RMS-C-77|79G) mit Lineartisch und Roboter, perisens
- Frequenz: 76,5GHz
- Transmissionsbild (Einweg) mit 294 x 234 Pixeln (Pixelgröße 1,5mm)
- PET-Folie mit Dk=3,22 und d=350um
- Aluminiumsubstrat mit Meoxal®-Farbe
Mit freundlicher Unterstützung von Merck


Weihnachtskarte 2021
Unsere Weihnachtskarte für 2021 zeigt unsere WiFi Channel State Information (CSI) Analyse, während das Lied „Jingle Bells“ mit einer Trompete gespielt wurde.
Die CSI ist in der Präambel des empfangenen Pakets der OFDM (Orthogonal Frequency Division Multiplexing) basierten WiFi-Standards wie IEEE 802.11a/n/ac/ax verfügbar. Normalerweise verwendet der Empfänger sie zur Kanalschätzung, um Daten wiederherzustellen, und verwirft sie dann. Die WiFi-CSI reagiert jedoch sehr empfindlich auf Veränderungen in der drahtlosen Umgebung, und durch die Verarbeitung der Daten im Laufe der Zeit ist es möglich, den WiFi-Chip als Sensor zu verwenden. Diese Technologie wird als WiFi Sensing bezeichnet, und ihre typischen Anwendungsbereiche sind die Erkennung der Anwesenheit von Menschen, die Erkennung von Gesten, die Erkennung von Eindringlingen und die berührungslose Überwachung von Vitaldaten (Atmung und Herzfrequenz). Diese Anwendungen können auf Verbrauchergeräten implementiert werden und parallel zu bestehenden Verbindungen laufen, ohne die Datenübertragung einzuschränken.
Für unsere Weihnachtskarte haben wir mit MATLAB eine IEEE 802.11ax PHY (Physical Layer) Basisband-Wellenform erstellt. Diese Wellenform wird dann mit Hilfe von Ettus X300 Software-Defined-Radios (SDRs) im 2,4-GHz-Band hochkonvertiert, gesendet und empfangen. Das empfangene Signal wurde in das Basisband zurückgewandelt und in MATLAB analysiert. Die WiFi CSI-Amplitude wurde in einem Spektrogramm aufgezeichnet. Im Spektrogramm können wir die Auswirkungen der Fingerbewegungen unseres Kollegen sehen, während er „Jingle Bells“ mit einer Trompete spielte. Unser WiFi CSI-Analyse-Framework verwendet Signalverarbeitungsalgorithmen und kann weitere Aufgaben erfüllen, z. B. die Erkennung und Zählung der Atembewegungen einer Person.
Wie wir auf unserer Weihnachtskarte sehen, kann die WiFi CSI sogar sehr kleine Bewegungen in der Umgebung erkennen. Derzeit ist der Zugriff auf die WiFi CSI nur bei einer kleinen Anzahl von Geräten implementiert, was auch die Anzahl der verfügbaren Anwendungen, die darauf basieren, begrenzt. Es wird erwartet, dass sich diese Situation mit dem kommenden WiFi-Sensing-Standard IEEE 802.11bf ändert und WiFi zu einem vollständigen Sensing-Paradigma wird und die Art und Weise, wie wir mit Geräten interagieren, verändert. Sobald die WiFi CSI auf Kundengeräten verfügbar ist, wird ihre korrekte Verarbeitung für die Zielanwendung von großer Bedeutung sein.
Weitere Informationen über CSI-Sensorik finden Sie in unserer Veröffentlichung „In-Vehicle Breathing Rate Monitoring Based on WiFi Signals“ von der European Microwave Week (EuMW2020). Download hier.
Spezifikation der Weihnachtskarte
- Messsystem: Ettus X300 Software-Defined-Radios und Laptop mit MATLAB WLAN Toolbox
- Mittenfrequenz: 2,385 GHz
- Signalbandbreite: 40 MHz
- Format der Pakete: IEEE 802.11ax Single User SISO (Single Input Single Output)
- Antennen: Stabantenne mit 3 dBi Gewinn
- Antennen-Polarisation: Vertikal
Weihnachtskarte 2020
Unsere Weihnachtskarte aus dem Jahr 2020 wurde mit unserem Radom-Messsystem (RMS-D-77|79G) gemessen, das mit einer Scanning-Positionierungseinheit ausgestattet ist.
Sie zeigt ein ortsaufgelöstes 1-Weg-Transmissionsbild eines auf eine PET-Folie gesprühten Weihnachtsbaums in Amplitude und Phase. Der Baum ist in uni grüner Farbe und die Kugeln in silberner Metallicfarbe aufgesprüht. Der 100 um dicke Unilack erzeugt eine Phasenverschiebung von 6 Grad mit minimalen Auswirkungen auf die Dämpfung. Die viel dünnere Metallicfarbe von nur 20 um erzeugt eine Phasenverschiebung von 10 Grad und erhöht die 1-Wege-Dämpfung um 0,7 dB. Dies zeigt den starken Einfluss von Metallic-Beschichtungen. Die Aluminiumpigmente in der Metallic-Lackierung, die zur Erzeugung eines visuellen Flip-Flop-Effekts verwendet werden, erhöhen die elektrische Dichte (=Permittivität) von ~3 für den Unilack auf ~30 für den Metalliclack erheblich. Dies erhöht die Reflexionen und verringert die Transmission, was insbesondere bei Radarsensoren für hochautomatisierte Fahrfunktionen kritisch werden kann.
Daher ist es wichtig, den Einfluss von Lacken und lackierten Oberflächen (z. B. Stoßstangen) auf Radarsensoren in Kraftfahrzeugen zu untersuchen. Der RMS ermöglicht die Charakterisierung von Materialien, einschließlich Autolackschichten in Dicken von nur 10 um. Hersteller von Autolacken und Pigmenten nutzen das RMS-System weltweit, um die Eigenschaften von Lacken zu analysieren und radartransparentere Lacke zu entwickeln.
Spezifikation der Weihnachtskarte
- Messsystem: Radom-Messsystem (RMS-D-77|79G) mit xy-Lineartischen, perisens
- Frequenz: 76,5GHz
- Transmissionsbild mit 51 x 84 Pixeln (Pixelgröße 3mm)
- PET-Folie mit Dk=3,22 und d=350um
- Grüner Unilack mit Dk=2,3 und d=100um
- Silberne Metallicfarbe mit Dk=31 und d=20um


Weihnachtskarte 2019
Unsere Weihnachtskarte aus dem Jahr 2019 wurde mit unserem Radom-Messsystem (RMS-D-77/79G) gemessen, das mit einer Scanning-Positionierungseinheit ausgestattet ist.
Sie zeigt ein räumlich aufgelöstes 1-Weg-Transmissionsbild eines blauen Sterns, der auf silbernes Zeichenpapier in Amplitude und Phase gesprüht wurde. Die Acrylfarbe erhöht die Einwegdämpfung um ~0,3 dB und erzeugt eine Phasenverschiebung von ~10 Grad. Heutige automobile Radarsensoren verwenden die Phaseninformation der empfangenen, zurückreflektierten Welle zur Ableitung des Zielwinkels (Direction of Arrival). Daher ist es notwendig, dass eine Radarabdeckung eine homogene Phasenverschiebung verursacht. Abweichungen von 10 Grad können die Winkelmessung beeinträchtigen und bergen das Risiko einer falschen Fahrspurzuweisung.
Das RMS-System ermöglicht es Automobilherstellern und ihren Zulieferern, die Radarleistung von Radarabdeckungen zu analysieren und radartransparente Abdeckungen zu entwickeln. Die RMS-Systeme sind auch in einem robusten Aluminiumoxid-Gehäuse erhältlich, um End-of-Line-Tests von Radarabdeckungen durchzuführen und die Qualität in der Produktion sicherzustellen.
Spezifikation der Weihnachtskarte
- Messsystem: Radom-Messsystem (RMS-D-77|79G) mit xy-Lineartischen, perisens
- Frequenz: 76,5GHz
- Transmissionsbild mit 51 x 67 Pixel (Pixelgröße 3mm)
Weihnachtskarte 2018
Unsere Weihnachtskarte 2018 zeigt ein Radarbild eines metallischen Weihnachtsbaums in Co- und Cross-Polarisation bei 76,5 GHz.
Der Weihnachtsbaum wurde mit unserem Scanning Imaging Radar (SIR) gemessen, mit dem hochauflösende Radarbilder bei 76,5 GHz erzeugt werden können. Das erste Bild zeigt den Weihnachtsbaum in Co-Polarisation mit Empfangs- (RX) und Sendeantennen (TX), die beide horizontal polarisiert sind. Die Polarisierung einer Antenne bezieht sich auf die Ausrichtung des elektrischen Feldes einer gesendeten oder empfangenen elektromagnetischen Welle. Auf dem Radarbild sehen Sie die Metalloberfläche des Baumes und die Weihnachtskugeln als einen einzigen Punkt (den Spiegelreflexionspunkt).
Das zweite Bild zeigt denselben Weihnachtsbaum in einem kreuzpolarisierten Messaufbau mit horizontal polarisierten Sende- und vertikal polarisierten Empfangsantennen. Ein solches kreuzpolarisiertes Messsystem kann nur Signale von Geometrien empfangen, die den Polarisationszustand der elektromagnetischen Welle verändern. Dies geschieht an diagonalen Kanten, die die einzigen im Bild sichtbaren Strukturen sind. Oberflächen (wie die Oberfläche des Baumes und der Kugeln) sind dagegen völlig unsichtbar, da sie die Wellenpolarisation nicht verändern.
Heutige Radarsensoren haben nur co-polarisierte Antennen. Kreuzpolarisierte Antennenkonfigurationen sind derzeit Gegenstand der Forschung. Die Kreuzpolarisation kann zusätzliche Zielinformationen liefern, die zur Verbesserung der Zielklassifizierung genutzt werden können. Da die Leistung der kreuzpolarisierten Echowelle jedoch gering ist, kann dies nur im Nahbereich funktionieren.
Spezifikation der Weihnachtskarte
- Messsystem: Scanning Imaging Radar (SIR-77G), perisens
- Frequenz: 76,7GHz
- Reflektionsbild mit 100 x 150 Pixel (Pixelgröße 2mm)


Weihnachtskarte 2017
Unsere Weihnachtskarte von 2017 zeigt eine Folge von Frequenzrampen bei 76,5 GHz. Heutige automobile Radarsensoren verwenden frequenzmodulierte Dauerstrichsignale (FMCW) zur Erfassung von Entfernungs- und Dopplerinformationen.
Die Konfiguration der Frequenzrampen wurde festgelegt, und die komplexen Basisbanddaten (IQ-Daten) wurden in MATLAB berechnet. Um die Kanten des Baumes besser sichtbar zu machen, wurden die nach rechts oben verlaufenden Rampen mit einer binären Phasencodierung (BPSK mit einer Pulsdauer von 1us) moduliert. Die Modulation verbreitert die Rampe im Frequenzspektrum. In modernen MIMO (Multiple Input Multiple Output) Radarsensoren wird die Phasencodierung verwendet, um mehrere gleichzeitige Sendesignale in den Empfängerpfaden zu trennen.
Das FMCW-Radarsignal wurde mit einem Vektorsignalgenerator bei einer Zwischenfrequenz von 1 GHz erzeugt. Mit Hilfe eines Radar-Frequenzumsetzers (RFC) wurde das 1-GHz-Signal auf das Radarband (76,5 GHz) hochkonvertiert und über eine rechteckige Hornantenne in unserem Radarlabor gesendet. Das Radarsignal wurde dann mit unserem Radar Target Simulator (RTS) empfangen und mit unserem Radar Signal Analyzer (RSA) analysiert. Der RSA ist an den IF-Ausgang des RTS angeschlossen und ermöglicht eine Analyse von FMCW-Signalen.
Die Linearität von FMCW-Rampen ist entscheidend für die Qualität der Rohdaten eines Radarsensors. Unsere Radar Target Simulatoren und Radar Signal Analyzer werden für die Entwicklung zukünftiger Radarsensoren verwendet. Darüber hinaus werden unsere Geräte in der Produktion eingesetzt, um hochgenaue Referenzziele für die Kalibrierung der Sensoren zu erzeugen.
Spezifikation der Weihnachtskarte
- Messsystem: Radarzielsimulator (RTS-77|79G) mit Radarsignalanalysator (RSA), perisens
- Frequenz: 76,7GHz
- FMCW-Sequenz
- Trunk als 100us CW
- Blatt 1 Aufwärtsrampe von 68MHz in 10us
- Blatt 1 Abwärtsrampe von 68MHz in 200us | 1MHz BPSK moduliert
- Blatt 2 Aufwärtsrampe von 56MHz in 10us
- Blatt 2 Abwärtsrampe von 56MHz in 170us | 1MHz BPSK-moduliert
- Blatt 3 Aufwärtsrampe von 40MHz in 10us
- Blatt 3 Abwärtsrampe von 40MHz in 130us | 1MHz BPSK-moduliert
- Blatt 4 Aufwärtsrampe von 28MHz in 16,6s
- Blatt 4 Abwärtsrampe von 28MHz in 100us | 1MHz BPSK-moduliert
- Blatt 5 Aufwärtsrampe von 16MHz in 16,6s
- Blatt 5 Abwärtsrampe von 28MHz in 100us | 1MHz BPSK-moduliert
Weihnachtskarte 2016
Unsere Weihnachtskarte aus dem Jahr 2016 zeigt ein ortsaufgelöstes Reflexionsbild, gemessen mit unserem Scanning Imaging Radar bei der automobile Radarfrequenz von 77GHz.
Zuerst wurde das „Weihnachtsmanschgerl“ mit Liebe gebacken und kunstvoll verziert. Dann wurde es in unserem Hochfrequenzlabor vermessen und fotografiert. Das Radarbild wurde mit einem Abtastverfahren auf der Grundlage eines Radars mit synthetischer Apertur gemessen, das auch für die Fernerkundung in Flugzeugen und Satelliten verwendet wird.
Mit dem Scanning Imaging Radar (SIR) bewerten wir Radarabdeckungen (Radome) und stellen sicher, dass der Radarsensor nicht durch seine Abdeckung gestört wird. In einem gemeinsamen Projekt mit Continental, Volkswagen und der TU München wurde der Einsatz des Radars mit synthetischer Apertur für automobile Sensoren untersucht. Mit der Fähigkeit, sehr große synthetische Aperturen beim Passieren einer Szenerie zu erzeugen, können hochgenaue Radarumgebungskarten erstellt werden
Spezifikation der Weihnachtskarte
3D radar image:
- Messsystem: Scanning Imaging Radar (SIR-77G)
- Messblende 488mm x 646mm
- Resolution 78 561 pixels
- Auflösung 78 561 Pixel
- Acquired frequency range 75.7 to 77.7GHz (millimeter wave range)
Fotografie:
- Messsystem: D610 Spiegelreflexkamera, NIKON
- Messblende 4,6mm (50mm Objektiv)
- Auflösung: 24160256 Pixel
- Messzeit: 1/60s
- Erfasster Frequenzbereich 384 bis 789 THz (sichtbares Spektrum)


